My research focusses on using the chemical abundances measured from individual stars to tell us something about how our Milky Way (MW) Galaxy and its nearest satellite galaxies formed and evolved. I’ve also worked a lot to get AGES (a.k.a., the Galactic Astronomy Holy Grail) for stars.
If you are new to the field, click here for a short introduction!
Most of the data I analyze comes from the Apache Point Observatory Galactic Evolution Experiment (APOGEE), which is a near-infrared, high-resolution spectroscopic survey of red giant stars across the Milky Way and its closest satellites. I’ve had a lot of experience working with these data, from photons to chemical abundance numbers, so contact me if you every have any questions!
Table of Contents
The Sagittarius Dwarf Galaxy
Simulations and observations both suggest that our Milky Way Galaxy likely formed, at least in part, bu gobbling up smaller galaxies. The Sagittarius Dwarf Galaxy (Sgr) is a galaxy that is currently being destroyed and accreted by our own Milky Way! It’s only 30 kpc away, so its stars are accessible to high-resolution spectroscopy! The large field of view of the Sloan 2.5m telescope combined with the infrared capability of the APOGEE instrument make this galaxy an ideal target for the survey.
To date, we have observed some 300 stars, with that number growing as southern plates are observed. As published in Hasselquist et al. 2017, the stars in Sgr exhibit very different chemical abundances than the Milky Way stars. We argue that these differences can be explained if the later generations of Sgr stars formed from gas lacking ejecta from the most massive SNe, perhaps because these massive stars were never formed. This was first proposed by McWilliam et al. 2013, and the APOGEE data appear to support this scenario, as shown below.

While the paper does stress that the top-light IMF scenario is most likely, I’m willing to back off on that a little bit and say that a large Type Ia/Type II SNe ratio could explain the abundance patterns if we accept that the yields of some of the iron peak elements (e.g., Ni and Mn) are incorrect. Efforts are being made to use the chemical abundances of the Milky Way to better constrain these yields.
Another project I’ve done with the APOGEE Sgr data is to explore the extent to which we can “chemically tag” stars in the Milky Way as stars that once belonged to Sgr. As I mentioned, this galaxy is merging with the Milky Way, and there are Sgr stars strewn all over the Milky Way stellar halo.
In the work published in Hasselquist, Carlin, et al. 2019, we find that we can chemically tag stars belonging to “Sgr-like” dwarf galaxies, and find that another dwarf galaxy that is believed to have merged with our Milky Way some 8-10 Gyr ago has indistinguishable chemical abundance patterns from Sgr, at least when comparing the metal-rich stars.

The Magellanic Clouds and Galaxy Environments
APOGEE has also observed some 12,000 stars in the Magellanic Clouds. We’ve only just started to really delve into these data. One important result is that the chemical abundances from APOGEE show a clear signatures of very slow early star formation until some ~2 Gyr ago, when both galaxies, especially the LMC have experienced strong starburts. These starbursts were likely a result of interactions between the two galaxies.
For more details on this, see Nidever, Hasselquist, et al. 2020. There are many works that have already derived the star formation histories of these galaxies (e.g., Harris & Zaritsky 2009), but this is the first time we can look at what the chemistry says for many thousands of stars.
Because APOGEE is now no longer just a Galactic survey (some say “APOeGEE”, thanks Shetrone), we can compare the star formation histories as derived from their APOGEE chemical abundance patterns. The LMC and SMC both underwent recent starbursts, with the burst in the LMC being stronger than that of the SMC, as measured relative to the initial star formation rate. The Gaia Sausage/Enceladus (GSE) did not experience any starburst, as it was destroyed by the MW only part-way into its evolution. Sagittarius (Sgr) potentially experienced a weak recent starburst, but for some reason had a much higher initial star formation rate than the Magellanic clouds, even though it was thought to be about the same mass as the SMC. This is still a work in progress, but the conclusion is that environment clearly plays a role in shaping the detailed chemical abundance patterns of these galaxies, not just mass.

The Milky Way Disk
APOGEE offers an unprecedented view of the MW disk. Because APOGEE can peer through the dusty mid-plane, the chemical abundances of stars can be observed and analyzed across much of the disk.
I’ve been part of an ongoing project that is figuring out what the chemical abundances of stars across the Galaxy tell us about the MW. One key result from APOGEE is that if the MW stars are divided into high and low-alpha element groups, the chemical abundance patterns of the other elements do not vary within each group across the Galaxy. We then used these elemental abundance patterns to constrain the nucleosynthetic sites of these elements using what some of us are calling, the “Weinberg Approach”.
I also led an exploration into the carbon and nitrogen abundance patterns of MW disk stars. The abundances of these elements in the atmospheres of red giant stars are altered when a star goes from being a main sequence star to a red giant. In this dredge up process, nitrogen-rich material is brought to the surface, altering the surface carbon-to-nitrogen ratio, often expressed as [C/N]. Because the amount of material that gets dredged up is dependent on progenitor mass, the [C/N] abundance is a mass indicator of the star! From the mass, one can invoke stellar models to infer an age.
Well, because there are thousands of CO and CN features across the APOGEE spectra, every red giant star has precise (< 0.05 dex) [C/N] measurements. I led a project in analyzing how the [C/N] abundances of stars change across the MW, and found strong evidence for radial migration playing a role in shaping the age-metallicity relations of the MW disk. Published here.

The Inner Milky Way
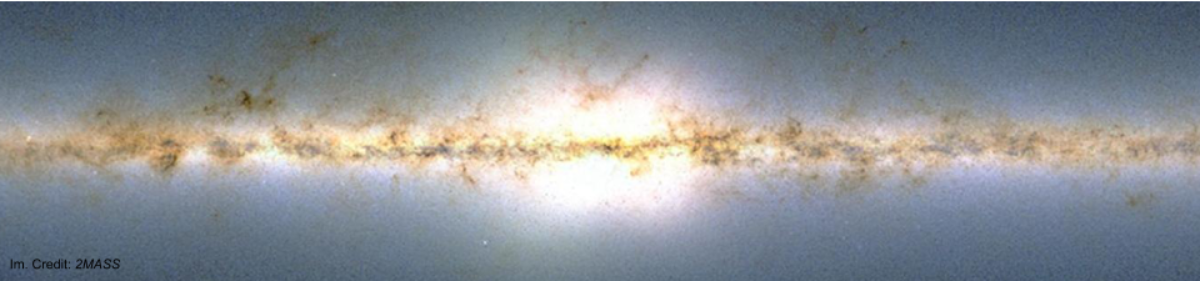
Wouldn’t it be great if we could get ages for luminous giants located all across the Milky Way Bulge? In Hasselquist et al. 2020, we set out to do this!
First we must all be amazed by the inner Galaxy coverage with APOGEE:

Many works (Martig et al. 2016, Ness et al. 2016, etc.) have shown that we can get ages for APOGEE stars. However, these works rely on the APOKASC-2 training set which does not have good masses/ages for luminous stars with log(g) < 2.0. Unfortunately nearly the entire APOGEE bulge sample is made up of these stars! Therefore, using this APOKASC-2 sample as a training set implies that data-driven models or neural nets are extrapolating to get ages for these stars.
We derive ages for the luminous bulge stars by using The Cannon (Ness et al. 2015) with a training set made up of stars with well-known


Chemically Peculiar Stars
It’s no secret that I like heavy metal. My first first author paper was on lines of neodymium (Nd, Z=60) in the APOGEE spectra. Naturally, I wanted to find more heavy metal in stars, which led to this project with Drew Chojnowski in which we found hundreds of chemically peculiar A and B stars. What gives these stars away are their strong features of doubly ionized cerium (Ce III). Some of this work has been published here.

And then here’s a catalog of HgMn stars discovered in APOGEE for those of you who are really into weird spectra. Full details described in this work.
